【Gnuplot】multiplotを使って複数のグラフを一つにまとめる方法
始めに
下記のサイトに従えば主な使い方は分かると思いますが、マージンの設定や、SVGファイル(あるいはepsなど他の形式)で直接出力する方法についてまとまった記事が無かったのでここにまとめておきます。
直接svgファイルで出力する方法
今回使っているdatファイルはこちらからダウンロードしてください。
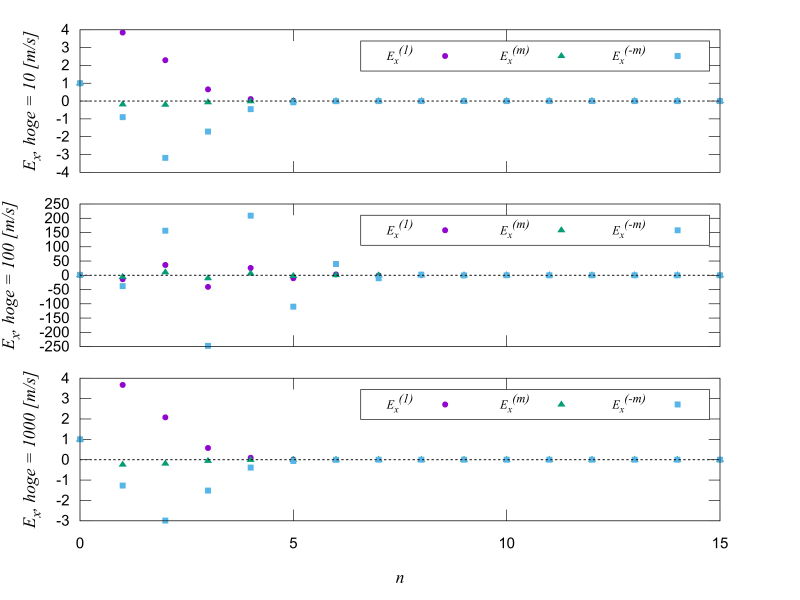
datファイルを用意した状態で下記のコマンドを実行すると、直接svgファイルのグラフが出力されます。
reset

set terminal svg enhanced font "Arial, 24" size 1280 960 # svg出力、1280px x 960px
set output "example.svg"
set multiplot layout 3,1 # 3行1列出力
set key horizontal opaque box height 0.6 font "Times New Roman, 20" # 横長の凡例
set xr[0:15]
set xtics (0, 5, 10,15)
set yl font "Times New Roman, 28"
set rmargin screen 0.9 #キャンバスの長さの20%(100%-80%)の余白を右側に作る
set lmargin screen 0.1 #キャンバスの長さの20%の余白を左に作る

set yl "{/:Italic E_{x}, hoge = 10 [m/s]}"
set format x ""
set bmargin screen 0.7128 #グラフの高さとグラフ間の余白設定
set tmargin screen 0.9504
plot "example1.dat" using 1:2 w p ps 0.5 pt 7 title "{/:Italic {E_{x}}^{(1)}" , \
     "example1.dat" using 1:3 w p ps 0.5 pt 9 title "{/:Italic {E_{x}}^{(m)}" , \
     "example1.dat" using 1:4 w p ps 0.5 pt 5 title "{/:Italic {E_{x}}^{(-m)}" , \
     0 w l dt (5, 5) lw 1.5 lt rgb 'black' notitle

set yl "{/:Italic E_{x}, hoge = 100 [m/s]}"
set format x ""
set bmargin screen 0.4224 #グラフの高さとグラフ間の余白設定
set tmargin screen 0.66
plot "example2.dat" using 1:2 w p ps 0.5 pt 7 title "{/:Italic {E_{x}}^{(1)}" ,\
     "example2.dat" using 1:3 w p ps 0.5 pt 9 title "{/:Italic {E_{x}}^{(m)}" ,\
     "example2.dat" using 1:4 w p ps 0.5 pt 5 title "{/:Italic {E_{x}}^{(-m)}" , \
     0 w l dt (5, 5) lw 1.5 lt rgb 'black' notitle

set yl "{/:Italic E_{x}, hoge = 1000 [m/s]}"
set format x "%g"
set bmargin screen 0.132 #グラフの高さとグラフ間の余白設定
set tmargin screen 0.3696
set xl "{/:Italic n}" font "Times New Roman, 28"
plot "example3.dat" using 1:2 w p ps 0.5 pt 7 title "{/:Italic {E_{x}}^{(1)}" ,\
     "example3.dat" using 1:3 w p ps 0.5 pt 9 title "{/:Italic {E_{x}}^{(m)}" ,\
     "example3.dat" using 1:4 w p ps 0.5 pt 5 title "{/:Italic {E_{x}}^{(-m)}" , \
     0 w l dt (5, 5) lw 1.5 lt rgb 'black' notitle
unset multiplot
unset output
コマンドについての注意
set terminal svgをset terminal epsなどに変更することで出力するファイル形式の変更可能
terminalの種類を変えることで出力するファイル形式を変更できますが、文字化けが起こる可能性があり、svg形式では上手く表示できたのにeps形式に変えると上手くいかない、というような場合があります。ファイルの保存形式を変更(例:utf-8 → Shift-JISなど)することで文字化けを避けられることがあります。
- 各ファイル間の余白は
set rmargin screen xxxのようにすることでキャンバスに対する余白の割合を変更可能 - キャンバスのサイズを上手く設定すれば余白の設定は不要
- 凡例の位置や向きは
set key vertical right outsideなどで変更可能。詳しくはこちら。